2019 IS NOT THE RIGHT BASELINE BENCHMARK EITHER
Note: 2q’2024 earnings calls begin this week; airline stocks were hit hard on July 5, 2024; blaming the OEMs (thinking they might be the savior for some) is not the only reason that airlines are cutting capacity and revising down revenue estimates; SkyWest’s market capitalization is 18% greater than the sum total of Allegiant, Frontier, Spirit, and Sun Country; remember when everyone believed that Frontier + Spirit = Juggernaut, the market cap of the combination is $1.4B; and how was the play Mrs. Lincoln?
This has been a work in progress over the past 10 years. It is not perfect. What this piece does is push the conversation to a sector-by-sector analysis and not a simple total capacity line to assess. Furthermore, thinking about market share in terms of premium and economy on an airport pair basis might be right as well. A company trying to de-commoditize should know what revenue it does not want.
OVERVIEW
The current makeup of the domestic airline marketplace in the US posits many questions. But every question needs an input on the level of capacity. But capacity is different from the old capacity just like a seat is no longer just a seat. If the level of today’s domestic Available Seat Miles (ASMs) flown by all sectors is deemed to be too much, then I surmise that the damage (adding too much capacity) was done between 2015 – 2019. There was little in the economy that justified the rate of growth in domestic commercial airline service during the period, particularly by Southwest and the ULCC sector.
It was June 6, 2017, when Doug Parker, then American Airlines’ CEO told shareholders at the annual meeting that: “My personal view is that you won’t see losses in the industry at all”. He went on: “We have gotten to the point where we like other businesses will have good years and bad years, but the bad years will not be cataclysmic. They will just be less good than the good years.”
The analysis suggests that 2019 is not the right baseline benchmark that we use to gauge the industry’s recovery either. The better benchmark period is located somewhere between 2017 and 2018. Then using a benchmark earlier than CY2019 as the basis for domestic capacity recovery would result in a number that many would say is too far ahead of itself today. Particularly if you buy the fact that too much capacity was deployed in CY2019. Sure, we have increasing numbers of passengers in the system. It is just that the capacity deployed is only generating sufficient revenue for 2-3 of the big 13 airlines operating.
Beginning in 2020, when assessing domestic industry capacity levels, it became time to think more about the respective airline sectors and the capacity produced by each rather than just looking at the industry without regard to airline or airline sector. This analysis points directly at the ULCC sector and Southwest as having too much domestic capacity deployed in CY2023. The irony is that each has a product that is out of favor with the air travel consumer – at least today. Passenger load factors and the revenue line make this clear on a sequential basis.
Finally, stakeholders across the spectrum love to glorify 2019 as the baseline benchmark highlighting an economically and financially healthy industry. From a perspective of financially healthy airline capacity the better year would have come before 2019. Either baseline would say that too much capacity has returned too fast. If I am in the ULCC sector I am thinking that smaller is better and opportunities will become available for some but not all.
The one thing where Parker was right is that he made those comments in 2017 and not 2019.
INTRO – THE CAPACITY DISCIPLINE ERA
Since the Pandemic-induced changes in the level of capacity deployed by the US airlines have altered the thinking of participants and stakeholders across the board, 2019 quickly became the baseline benchmark used to assess the state of the recovery. But is 2019 the right baseline benchmark? I have long wondered about it but had not taken the time to analyze it.
It is complicated. This attempt to put numbers measuring whether the US airline industry is either over/under capacity was triggered in the second half of 2023 when pricing fundamentals imploded – particularly for Southwest and the ULCCs. I will reference the eras of capacity deployment that Mike Wittman at MIT and I have analyzed along the way beginning with the Capacity Discipline Era that ran from 2010 – 2014.
The underlying assumptions made during the era were fundamental to any assessment of the industry’s economic and financial health. The foundational data point forever used has been the change in the Gross Domestic Product (GDP). Capacity Discipline became defined as the period where US domestic capacity or Available Seat Miles (ASMs) would grow at a rate slower than the rate of growth in GDP.
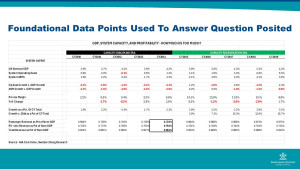
Between 2010 and 2014, the GDP grew at a simple average rate of 4.0% while system ASMs grew at a simple average rate of 1.7% and domestic ASMs grew at a similar rate of 1.1%. Domestic ASM growth over the period was 2.9 points less than the growth in GDP and system ASM growth averaged 2.3 points less than the growth in the economy.
Much was written about this period of capacity deployment. Wall Street fully embraced it (still does) causing Washington to become concerned about the fact that even Southwest would grow its capacity slower than the rate of growth in the economy in concert with the network carriers. It was an airport industry nightmare as any growth became a zero-sum game to add capacity.
The industry was emerging from the damning effects of the Great Recession. Southwest no longer had an oil hedge book resembling what they had in place between 2004 – 2008 that gave them an additional competitive cost advantage relative to virtually all other airlines. They too needed to find revenue to offset the loss of the advantages gained from hedging oil. [For another day, but why in the hell does this industry use profits from non-airline activity like hedging gains, credit card revenue and other activity to increase airline costs in perpetuity?] Calendar year 2011 would be the only year in the era where Southwest would grow domestic ASMs faster than the change in GDP.
The hybrid carriers comprised of Alaska, Hawaiian, and jetBlue grew ASMs grew 2 points faster than the average growth in the economy largely because jetBlue was still in its infancy. All the while, the ULCCs comprised of Allegiant, Frontier, Spirit, and Sun Country would grow capacity at a rate 6 points faster than the growth in the economy over the 2010 – 2014 period. This is where averages often do not tell the whole story. In 2014, these ULCCs would increase capacity by 15.3% or 11 points faster than the growth in GDP. The real-life application of the Prisoner’s Dilemma begins here.
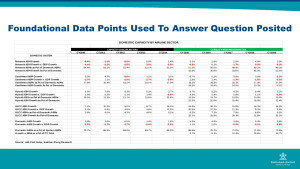
The relationship between the growth in capacity at rates less than the economic resulted in the industry pre-tax margin averaging 2.4%. The average of 2.4% includes the fact that the industry pre-tax margin in 2014 was 5.8%. In 2014, passenger revenue as a percent of nominal GDP was .724%; passenger and ancillary revenue as a percentage of GDP was .761%; and total revenue as a percent of GDP measured .961%. It could be surmised that the industry was set up for a long profitable period because of the discipline employed over the 2010 – 2014 period.
Finally domestic ASMs as a percentage of system ASMs were at their lowest level during the period at 69.3%. At year-end 2014, Southwest domestic ASMs would comprise 17.9% of the industry total. When the ULCC carriers are added to Southwest, the share of (U)LCC narrowbody, single aisle domestic ASMs would comprise 23.1% of all domestic ASMs.
The ULCC sector did not play along with the concept of capacity discipline but by 2014 they did their own jailbreak seeking parochial riches by growing ASMs at fast rates to win market share. And they did. For CY2010, the ULCCs were 20.4% of the size of Southwest. By 2014, they would be 29% the size of Southwest when measured by domestic ASMs.
The landscape was changing.
THE CAPACITY REGENERATION ERA
This era was dubbed the capacity regeneration era (2015 – 2019) as carriers began to grow at rates faster than the economy driven by the ULCC sector winning share not only versus the Big 3 airlines of American, Delta, and United but Southwest too. Overall, domestic ASMs would grow less than one-half of a percentage point faster than GDP. However, the story would be found when assessing the growth within the respective airline sectors – network, Southwest, hybrid, and the ULCCs.
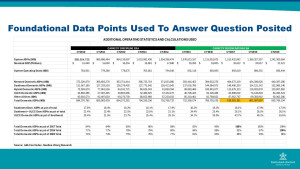
System (domestic + international) ASMs would grow an average of 3.7% over the period relative to the average growth in GDP of 4.1%. It was during this period that other network changes were taking place as well. Operating seats averaged a .3% decline as ASMs grew by 3.7%. Stage lengths were growing across all sectors.
The Big 3 grew ASMs over this period by an average of 3.4% that equated to an average of .7 points less than the growth in GDP; this is a period that began to put Southwest under a different light as it would grow capacity 2.6 points faster than GDP in 2015 and 2016, but would grow capacity at a rate 2.8 points slower than GDP between 2017 – 2019 and would actually reduce ASMs in 2019 versus 2018.
The hybrid carriers would add ASMs at an average annual growth rate of 6.2% over the period which was an average of 2.1 points above the growth in the economy. Each of the network carriers and Southwest grew domestic ASMs slower than GDP each year between 2017 – 2019. They would be joined in this capacity deployment decision by the hybrid carriers in 2019.
Over this 2015 – 2019 period, the ULCCs would increase domestic ASMs by an average year-over-year rate of 17.8% which was 13.7 points faster than the growth in GDP. In each year during this period, the ULCC rate of growth would decrease in absolute terms but not relative the other carriers in the domestic space.
Between 2015 – 2017, the industry would earn double-digit pre-tax margins. They would fall to high single digits in 2018. The absolute growth in domestic ASMs between 2015 – 2019 was equal to 16.7% of size of the domestic system in 2019. The growth in system ASMs over the period would be 19.7% of domestic ASMs in 2019. Domestic ASMs as a percentage of system ASMs would grow to the highest rate of 71.9% in 2019 since 2010. Passenger revenue, passenger and ancillary revenue, and total revenue as a percentage of GDP would decrease between 5-7%.
Given that the network carriers, Southwest, and the hybrid carriers would all grow domestic ASMs less than the rate of growth in the 2019 economy versus 2018 should be a flag. But the jailbreak ULCCs just kept on adding with little to no change in strategy or product.
During this period, ULCC domestic ASMs as a percentage of Southwest’s domestic capacity output could grow from 29.1% in 2019 to 55.6% in 2019. Between 2015 – 2019 the industry added 176 billion domestic ASMs. That growth equates to an airline 16% bigger than Southwest; more than twice the size of the entire ULCC sector in 2019; and more than 4.5 times the number of domestic ASMs added during the Capacity Discipline Era.
THE CAPACITY REGENERATION ERA REALLY WAS A SOUTHWEST CONUNDRUM
There are many operational and financial attributes that made Southwest THEE vaunted competitor through 2014. Its capacity growth would be used to continually average down costs up and down the income statement; its capacity growth created a “juniority effect” that would translate into industry leading productivity of labor and non-labor assets; and its network was built on its reputation of being the low fare provider that would spur air travel consumers to drive to an alternative airport to take advantage of.
During this 2015 – 2019 period, the industry would add 176 billion ASMs. The network carriers would add 69 billion, or 39% of the amount; the ULCC sector would add 47 billion ASMs, or 27% of the Capacity Regeneration Era’s growth; the hybrid carriers would add 32 billion ASMs or 18% of the growth; and Southwest would add24 billion, or 13% of the growth. Not the same Southwest. And the critical ingredient of growth during this period was largely absent. In fact, the absolute level of ASMs flown by Southwest in 2019 would be less than in 2018.
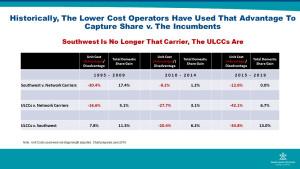
The chart above shows several critical competitive attributes. Until the recent application of the economic concept of cost convergence, lower cost operators would win the day particularly in the domestic and close in Latin markets. It was the cost advantage enjoyed by Southwest that fueled their rapid market share grab, particularly against the larger, pre-merger network carriers. Southwest used that cost advantage to the point where all the network airlines would file for protection under Chapter 11 of the US Bankruptcy Code. This would accelerate in the immediate post-9/11 period. Whether cost convergence is a concept applied to lower costs or force lower costs higher, it is a competitive tool that should be respected and not minimized in any way.
Southwest’s ability to win the share of ASMs added by it and the network carriers would dissipate between 1995 – 2014. During the Capacity Discipline Era, and despite its cost advantage relative to the network carriers, they would only realize an incremental 1.2-point gain in domestic share. It would be the ULCC sector that would use its newfound cost advantage relative to Southwest to win a greater share of the capacity added.
But it would be the 2015 – 2019 period where the ULCC sector would use their cost advantage to grow and win share at the expense of the network carriers to a degree but would be a bigger winner of share when capacity was added relative to Southwest. Between 2017 and the most recent reporting in 1q’2024, Southwest’s pre-tax margin would decline from 15.4% in 2017 year-over-year as the airline added capacity. Its margin would decline in 2019 v. 2018 despite cutting capacity.
Simply, Southwest has matured to a point where its growth cannot be sustained utilizing a point-to-point model only. It needs to incorporate connectivity to fill its large airplanes as the ULCC sector reduces the reach of the catchment areas by offering service at airports that used to drive to fly Southwest. As this model evolves, can its historic way to generate revenue from a point-to-point network relying on local traffic now generate a different revenue mix of local and connecting revenue? Building connectivity and generating revenue to offset increasing costs are challenging the fabric of Southwest.
As Mike Levine wrote in 1992: 1) Size confers advantages and disadvantages. Networks can be an effective way to combine flows and economize on marketing costs, but they come with vulnerabilities to labor, operational and political problems and 2) LCCs can be successful, but they face major challenges in growth. A large LCC tends to be more vulnerable to labor cost pressures and must also compromise its commitment to point-to-point service to grow past the limits that route density places on those airlines.
THINK SOUTHWEST – HOW PRESCIENT!!
IS 2019 THE RIGHT BASELINE BENCHMARK?
To answer the question posited, total system ASMs were increased at the rate of growth in GDP between 2015 – 2019 for each airline sector. These pro forma ASMs were then subtracted from the actual ASMs flown. Based on this simple analysis, or not so simple as it is an accepted approach across the industry, the ULCCs flew a cumulative total ASMs between 2015 – 2019 of 35.3 billion more ASMs than if the limit was the growth in the economy. Based on an average year-on-year percentage of ASMs flown over and above growth in the economy, then the 2019 capacity level is 11-12% too big versus what economic growth would suggest.
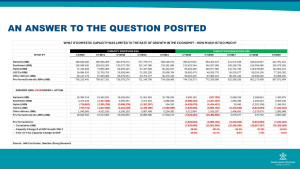
Going back to the positive results the industry achieved during the Capacity Discipline Era particularly when measuring all things revenue as a percent of GDP, in 2015 and 2016 the industry grew capacity at rates greater than the economy and the revenue measurements as a percent of GDP declined sequentially. Then in 2017, when ASM growth was less than GDP then the revenue measurements relative to GDP began to improve again sequentially.
Ironic? I do not think so. The analysis thus far suggests that the 2019 baseline benchmark mindset is not the best one whether per sector or airline. The per-sector thinking should become part of any benchmarking that is performed. The question then becomes what is he mix of seats/ASMs inside of the capacity portfolio that will produce sustainable results for all in the industry?
THE PANDEMIC ERA – DURING AND POST
Any attempt to account for capacity deployed in either 2020 or 2021 seems like a rabbit hole that is not necessary to go down – therefore I am not. But this analysis is attempting to seriously answer two burning questions: 1) is 2019 the right baseline to benchmark against? and 2) given the financial condition of all airlines but Delta, United, and Alaska, the revenue generation suggests that there is too much capacity deployed today as it is not commensurate with the added capacity. If that is the case, HOW MUCH IS TOO MUCH?
The analysis of over/undercapacity begins with producing a calculation of how much capacity would be deployed by airline sector if the growth in GDP was the limiting factor. If that is the case, then there would have been 898 billion domestic ASMs flown in 2019 v. 893 billion. On the surface, it suggests that the bottom-line domestic capacity produced was right where the economy would suggest.
However, when assessing by sector, we know that all but the ULCCs were slowing any growth in capacity between 2017 and 2019 as margins were decreasing along with revenue production relative to GDP. The ULCCs however – the prisoners with the dilemma – were growing domestic capacity aggressively when compared to the other carriers. Assuming the ULCCs would have grown capacity no greater than at the rate of the economy between 2015 – 2019, then the sector would have flown a cumulative 35 billion fewer ASMs. The 35 billion number represents 42% of the size of the entire ULCC sector at CY2019. The analysis suggests that the ULCC sector is at least 9.3% overcapacity at the end of 2023.
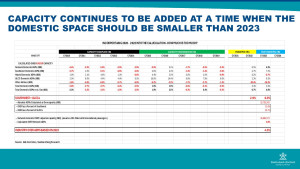
The analysis also suggests that Southwest was overcapacity at CY2023 by 7.5%. When the calculated overcapacity ASMs for Southwest and the ULCC sector are combined, the two sectors are currently in the process of reducing the 23 billion too many ASMs flown in 2023. To put that 23 billion ASMs in perspective, it is the equivalent of 13.8% of Southwest’s 2023 domestic ASMs and 20.7% of the ULCC sector’s 2023 domestic ASMs. The analysis also points to 4.3% overcapacity in the network sector. However, that number needs adjustment downward to account for domestic seats occupied by international passengers to/from a gateway airport.
Whereas pre-tax profit margins show improvement between 2021 and 2023, the CY2023 profits are being earned by 3 airlines. The relationship between disciplined capacity deployment and airline profitability is undeniable. It is clear through this analysis that capacity, domestic capacity, needs to be removed. Latin American capacity in the Caribbean and Central American regions should carefully assessed as well.
Like any analysis done on the topic, it suffers a lack of any definitive takeaways during CY2020 and CY2021. Every ULCC and Southwest has announced, and or continue to adjust, capacity reductions in 2024. Again, it cannot be overemphasized that the industry added 176 billion domestic ASMs during the Capacity Regeneration Era. The ULCCs accounted for 47 billion and Southwest 24 billion in incremental domestic ASMs. Despite slowing growth relative to GDP over the last 3 years of the 2015 – 2019 period, margins were falling, revenue generation was falling short of expected growth, and domestic capacity was a greater percentage of system output.
FINAL THOUGHTS
The two-year gap between 2019 and 2021 will not allow a definitive analysis of domestic ASMs that might need to be reduced today. However, the analysis points to a 2024 domestic industry that should be at least 4% smaller in absolute terms than in 2023. However, it will be larger despite the capacity cuts being made by airlines in all sectors and from the OEM dampening effects.
There is a role for the ULCCs going forward to be sure. Their timing to provide capacity to those with a thirst for travel during the Pandemic was near perfect. Southwest took advantage of the Pandemic opportunity as well to add nodes that would increase connectivity. Now the ULCCs and Southwest account for 30 percent of domestic ASMs. The cost structure that now permeates an industry that was formerly vigilant on costs demands increasing revenue.
Neither Southwest nor the ULCC sector offer a product that can sustainably support 30% of the domestic capacity in the US. Using 2019 as the baseline benchmark is not the right data point as the industry was overcapacity then. Now we try to benchmark the industry’s capacity recovery as a percentage of a past point in time where it is now clear that the industry’s capacity growth was not supported by the growth in the economy – local, regional, or otherwise.
If the consumer proves to demand a premium airline product over the longer term, either the ULCC sector needs to get smaller, Southwest needs to shrink before it grows again, or both need to reduce their domestic footprint.
There is little in this analysis that tells me that the status quo is financially sustainable in its current form. The slides that follow track domestic capacity since deregulation. The analysis works backward from today’s airline makeup of the respective airline sectors. So, the Big 3 network carriers shown in 1978 would include all the carriers merged to form the respective groups today.
Whereas capacity deployed impacts a myriad of issues ranging from operational to financial, it just might be that it is the mix of airline capacity is becoming just as important, if not more important, than the sum of capacity produced by all sectors.

Recent Posts
EXPLAINING OUR VIEWS ON TOO MUCH CAPACITY TOO MUCH SEAT CAPACITY OR THE WRONG SEAT CAPACITY MIX? WHETHER ASMs OR DEPARTED SEATS ARE THE MEASURE, EACH POINTS TO A DOMESTIC INDUSTRY WITH TOO MUCH CAPACITY. and 2019 IS NOT THE RIGHT BASELINE BENCHMARK Swelbar-Zhong Consultancy PREAMBLE The first version of this paper was made available to the public on July 7, 2024. Like in the past, it focused on the relationship between the change in the Gross Domestic Product (GDP) and the change in Domestic Available Seat Miles (ASMs) between 2010 – 2023 within the eras of capacity deployment
EXPLAINING OUR VIEWS ON TOO MUCH CAPACITY TOO MUCH SEAT CAPACITY OR THE WRONG SEAT CAPACITY MIX? WHETHER ASMs OR DEPARTED SEATS ARE THE MEASURE,
The iconic Rolling Stones song has many interpretations as to its meaning. All the way from worshiping the devil, to a role reversal in a male-female relationship, to suppression of individuality according to The Socratic Method. Over the last day or so I have been thinking about the number of happenings within the U.S. airline industry involving change agents and airlines. I was thinking about a role reversal and now it seems that change agents/banks have airlines under their thumb. Today, June 12, 2024, most applications of the bankruptcy code are not the same tools that they were in 2005.
The iconic Rolling Stones song has many interpretations as to its meaning. All the way from worshiping the devil, to a role reversal in a
Or has my airline been too slow to respond? Or … I am finally getting around to writing the first post on my new blog site. Writing anything before now has not been for a lack of want but rather to write I must feel it. And I have not been feeling it. But after weeks of – if someone does not win the game must be rigged, the one piece I always intended to lead with was Spirit CEO Ted Christie calling the U.S. airline industry a rigged game that only favors the Big 4 (American, Delta, United, and
Or has my airline been too slow to respond? Or … I am finally getting around to writing the first post on my new blog
#SmallerCommunityAirServiceDevelopment Yesterday's headline in the Lincoln Journal Star read: "Some sparks fly, but Lincoln Airport Authority board gives director a vote of confidence".
